

No products in the cart.
Wood Fiber Insulation
INSULATION TRULY MATTERS
31
Mar
Mar
ABSTRACT
There are many opinions in industry with regard to appropriate material choices for sheathing membranes and exterior insulation of framed wall assemblies. Opinions vary on what is sensible for the vapour permance of materials outboard of the framing so that not only will wetting and drying will be in harmony, but other interests such as costs, wall thickness, and energy efficiency targets can be met. Some common positions held by industry stakeholders in heating dominated climates include:
1. Drying to the exterior is paramount, therefore the higher the permeance the better,
2. Vapour flows in both directions, so there is a “Goldilocks” permeance that should be determined on projects, especially for walls with absorptive cladding,
3. The vapour permeance of the materials outside of the sheathing is irrelevant as long as enough exterior insulation is provided outboard of the sheathing.
Many of these opinions rely on assumptions for rational test conditions such as indoor humidity, construction moisture, air leakage, and rain penetration, which may or may not represent realistic conditions. In addition the majority of past work is focused on field area of the wall rather than at framing and junctions. This is an oversight since walls often get wet by rain at framing junctions, during and after construction, and the membranes at junctions are often not the same as in the field area.
Many industry stakeholders struggle to make sense of these seeming contradictory viewpoints and how to assess the benefit of specific products beyond the context of code minimums. An approach to overcome this struggle is to develop design guidelines that outline the design limits of materials applied to specific configurations, where hygrothermal performance criteria will be satisfied. An example of a design limit is the maximum amount of moisture that can penetrate past the moisture barrier due to a rain leak without the framing being at risk of deterioration.
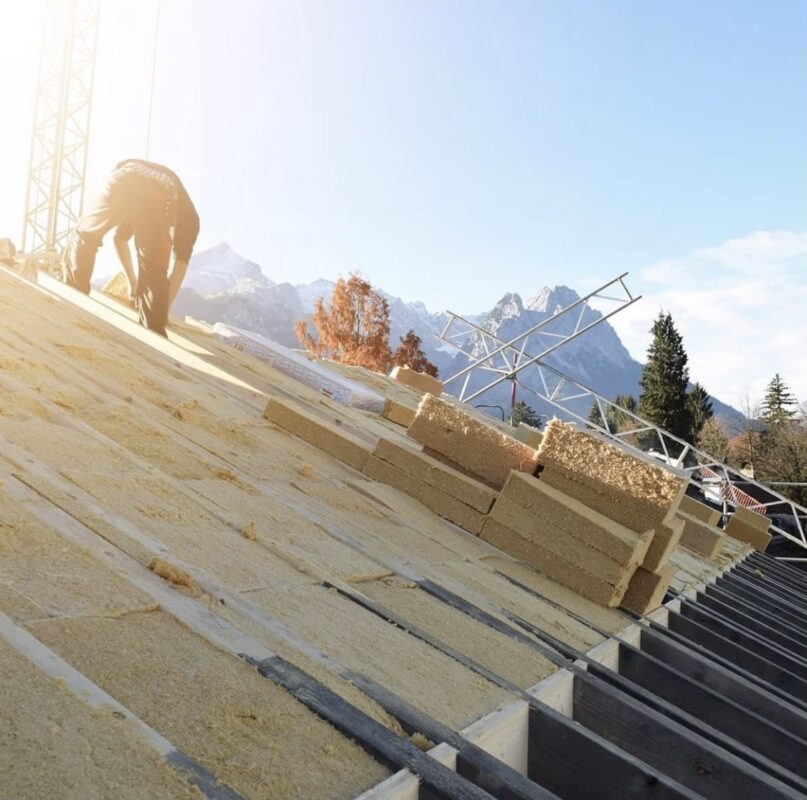
We at GSWRAP believe in high efficiency and good insulation, that is why we provide the best tapes and wood fiber insulation boards for your projects. In today’s blog we want to make it knowledgeable on why insulation matters, and how you can know if you have the proper insulation in your home.
INTRODUCTION
With an increasing trend towards higher building envelope insulation levels to meet more stringent building energy requirements many designers have looked to split insulated framed wall assemblies as a means of achieving higher building envelope R-values. However, higher levels of insulation, when not entirely outboard of the structure, often raises questions about hygrothermal performance. The selection of weather resistive barriers (WRB) and insulation are important considerations when trying to balance hygrothermal performance with costs, wall thickness, and energy targets. Designers often rely upon collective wisdom to help select materials for their wall assemblies. Many of these positions are based on broad assumptions that apply to specific conditions which may or may not be relevant to the conditions that the assemblies will be exposed to in service. For example, some designers value the importance of drying to the exterior based on the assumption that the dominant direction of vapour flow in a cold climate is to the exterior and choose exterior insulations and WRB membranes with higher vapour permeance. Others may be concerned with inward vapour flow from rain held in absorptive cladding in the summer and look to avoid highly vapour permeable membranes. Others may deem the vapour permeance of the insulation and membrane materials irrelevant as long as enough exterior insulation is provided to control moisture accumulation of the exterior sheathing as a result of exfiltration in the winter and trust that rain leaks are adequately controlled through proper detailing. While the science behind these assumptions are sound, not all of these assumptions apply to all wall assemblies and conditions. Moreover, simplistic viewpoints often overlook risk mitigating factors, such as the removal of moisture from absorptive cladding via ventilated rain-screen cladding. Conversely, some views are too simplistic, such as overlooking the impact of a rain leak below an impermeable sub-sill membrane.
Often the focus of detailing at critical junctions, such as window sills or base of wall, is on air- and water- tight details. This focus is well supported by past research that showed that a large percentage of building envelope failures can be attributed to inadequate detailing at these same junctions (Morrison Hershfield, 1996). However, hygrothermal analysis often focuses on the centre or field area of the wall, while ignoring the structural framing where impermeable membranes are often used. This practice often contributes to differing opinions about the real risk of deterioration due to rain-leaks when selecting acceptable insulation and membrane materials. The underlying point of disagreement is that the analysis that supports the selection of one product over another is often based on too simplistic models of natural phenomena that walls are subject to in service. The three most common culprits are:
- Advocating one type of insulation and/or membrane based on analysis done for static assumptions and comparing the relative difference, but not relating the difference to any performance threshold or consequences,
- Evaluating the risk of rain-leaks using one-dimensional models and arbitrary quantities of rain-leaks, such as 1% of the water reaching the exterior surface (ASHRAE Standard 160), and
- Neglecting to evaluate both the wetting and drying characteristics of air leakage, which can neither be practically eliminated with regard to wetting nor relied upon for drying.
This paper discusses why some of these practices are too simplistic and outlines a holistic approach to hygrothermal modeling for framed wall assemblies in both the field area of the wall and at the framing. The objective of the paper is to show how this approach can be applied to design limits that will aid designers and decision making on projects. Hygrothermal design limits such as insulation ratio, maximum indoor humidity load, and maximum allowable rain penetration are introduced with examples for consideration and discussion.
METHODOLGY
This section presents the methodology and example scenarios to demonstrate how design limits can be employed in practice.
Hygrothermal analysis presented in this paper was done with 1-D and 2-D finite element heat-air-moisture transient simulations using DELPHIN. This program was developed by the Technical University of Dresden (TUD) and is capable of simulating the combined effects of heat flow, airflow and moisture flow. Heat flow is by conduction, convection, radiation and phase change. Airflow is laminar and the path is determined by the user. Moisture flow is by convection, vapour diffusion, capillary suction and adsorption. Material properties are based on published properties from ASHRAE RP-1018 and from Task 3 of the MEWS project (Kumaran et al, 2002).
Wall Assembly
The example generic wall assemblies presented in this paper are split insulated steel frame and wood frame walls with insulation in the stud cavity and outboard of the structural framing. An overview of the wall assemblies is provided in Figure 1. A wood stud sill plate and sheathing are included in the 2-D wall assembly for models evaluating vapour permeable membranes on the wetting and drying of sill plates.
Exterior
- Generic lightweight rainscreen cladding (fiber cement) or brick veneer
- Mineral fiber insulation or polyisocyanurate insulation
- Weather resistive barrier (WRB) membrane
- 1⁄2” (13mm) plywood sheathing
- 2×4 steel or wood framed stud cavity with R-13 batt insulation or 2×6 steel or wood framed stud cavity with R-19 batt insulation
- Interior drywall with interior vapour control (0.5 perm)Interior
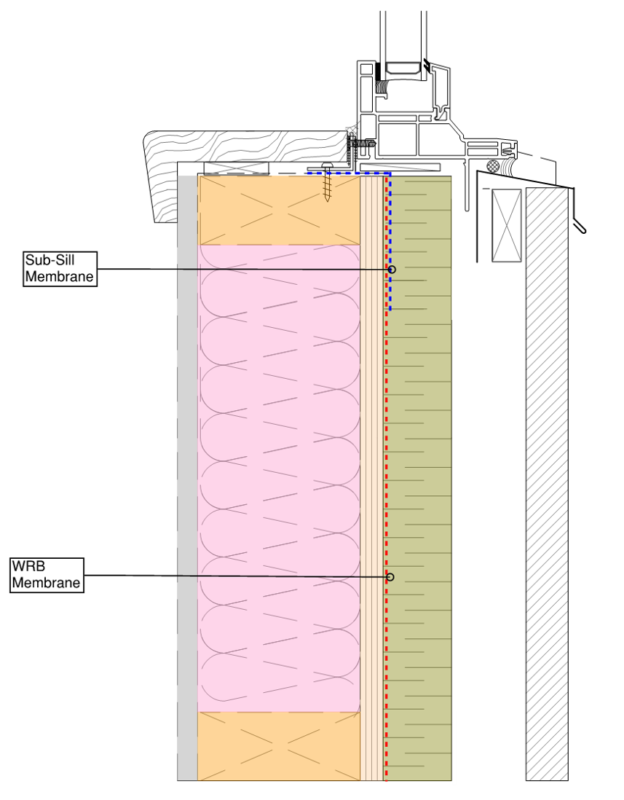
Figure 1: Overview of evaluated framed wall assembly
CLIMATE
Examples for Vancouver, Toronto, and Edmonton are presented, which are representative of mild, mixed, and cold Canadian climates, respectively. Selected years based on representative wet years with the highest wetting index as determined by the MEWS study (Cornick, 2002) were selected for the analysis. These wet years represent periods with the greatest potential for wetting and the lowest potential for drying. A list of representative wet years is provided in Table 1.
Table 1: Representative wet years evaluated in the analysis
Location | Climate Zone | Simulated Climatic Data |   ASHRAE 90.1 – 2013 Climatic Data
| ||||
Wet Weather Year | Annual Rainfall, inches (mm) | Heating Degree Days 65oF (18oC) | Cooling Degree Days 50oF (10oC) | Heating Degree Days 65oF (18oC) | Cooling Degree Days 50oF (10oC) | ||
Vancouver, BC | 4C | 1980 | 47 (1206) | 5810 (3109) | 1291 (717) | 5682 (3157) |  1536 (853) |
Toronto, ON | 6 | 1982
| 28 (714)
| 7601 (4117) | 1955 (1086)
| 7306 (4059)
| 2703 (1517)
|
Edmonton, AB | 7 |  1988 | 18 (460) | 9381 (5095) | 1215 (675) | 11023 (6124) |   1069 (594) |
Acceptance Criteria
Performance criteria based on established damage criteria and issues related to high moisture levels, such as mold growth, is needed to move beyond analysis that relies solely on comparing between assemblies to make decisions.
Wood products experience moisture related problems such as mold growth and loss of structural integrity occur over prolonged periods of elevated moisture content (Wang et al, 2010). The amount of damage is dependent on the moisture content, temperature, and material. While lab studies have shown some wood products such as OSB and plywood sheathings are able to withstand decay while subjected to elevated moisture levels, greater than 28% MC, for periods longer than 21 weeks (Wang et al, 2010), it is widely recognized that wood products will decay at moisture levels greater Paper #103
Figure 2: Comparison of hourly and 7-day running average plywood sheathing moisture content of east- facing split insulated wood-frame wall in Vancouver with 1% rain penetration, not subjected to air leakage.
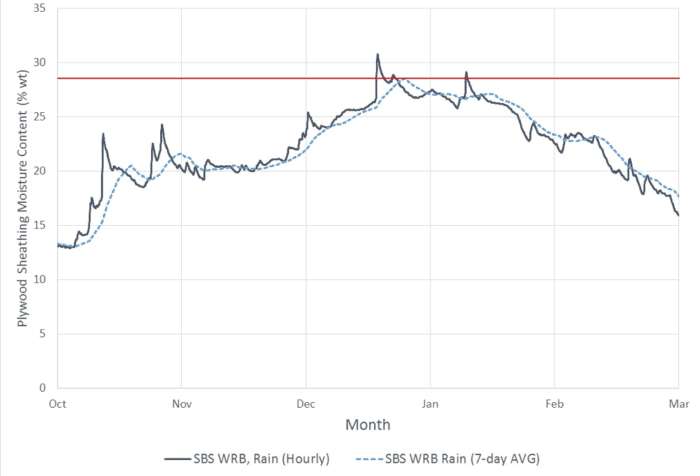
Based on these studies, an acceptance criteria of 7-day running average moisture content below 28% MC was selected for assessing the design limit with regard to wood decay. The 7-day running average filters out identifying false positives, such as spikes in moisture content that momentarily raises moisture levels but quickly dries out without resulting in any moisture related problems. Momentary spikes in from air leakage and rain penetration that raises moisture levels for a short period of time are filtered out.
Gypsum based products also experience moisture related problems when exposed to elevated moisture levels. Mold growth on gypsum based products, such as paper-faced drywall, will occur starting at a relative humidity of 80% when exposed for an extended period of time (Viitanen et al, 2007). In addition, gypsum based products will also start to decay when exposed to moisture for long periods. An acceptance criteria of 30-day running average surface relative humidity of less than 80% was selected since moisture accumulation increases at higher humidity levels. This acceptance criteria is based on assessing the risk of condensation and decay as the main failure modes similar to most building codes. While mold growth may negatively affect indoor air quality, it typically does not significantly reduces the structural integrity and durability of gypsum based products. There is also a high variability with mold growth as it is dependent on interior conditions, duration and material type. Due to this variability setting design limits based on mold growth may not be practical.
ENVIRONMENTAL LOADS AND DESIGN LIMITS
Design limits for environmental loads can be established to relate the maximum allowable limits a wall assembly can withstand and meet the established performance criteria. Environmental loads may be considered as uncontrollable, (e.g. climate, exterior temperature, humidity, rainfall, wind), influenced by design (air leakage rate, rain penetration rate etc.), or fully controlled by design (indoor humidity). The following section introduces these loads and how they are incorporated into the design limit approach.
Defining Indoor Moisture Loads and Limits
Interior humidity is an important design load when assessing the hygrothermal performance of building assemblies. High indoor humidity can result in moisture accumulation in the exterior sheathing due to vapour diffusion and exfiltration from the interior air. The indoor moisture load can be related to a design limit for a wall assembly by determining the maximum indoor moisture that a wall assembly can be subject to within the acceptance criteria.
Indoor humidity is often neither directly controlled nor constant in many buildings. Instead the indoor humidity is a function of the occupant activity, ventilation rate, and outdoor humidity. The moisture generated by occupants is balanced by its removal via ventilation and buildings with similar average ventilation and moisture production rates will have similar excess of moisture in the indoor air during the heating season compared to the outdoor air regardless of the climate. Ultimately, the indoor humidity of buildings with uncontrolled humidity fluctuates with the outdoor temperature, or more specifically, by the moisture content of the outdoor air. Work related to establishing indoor moisture levels for design is reported to date back to the 1970s (Roppel et al 2009, Kalamees et al 2009, Kumaran et al 2008). Buildings with air conditioning and dehumidification are not covered in this paper but can fit into the same framework of design limits.
Defining the indoor humidity using the concept of the difference of moisture in the indoor air compared to the outdoor air by vapour pressure difference (∆VP) is convenient in establishing design limits because the limits are supported by physics and moisture balances, by monitoring of buildings in operation, and defines the “load” directly with a single quantity, rather than many dependent factors such as indoor temperature, occupancy type number of occupants, ventilation rate, etc. Using this approach, the baseline scenario for the results presented in this paper is a vapour pressure difference of 540 Pa, representative of a medium indoor humidity load, while higher indoor humidity scenarios is a vapour pressure difference of 750 Pa. These vapour pressure differences describe an average excess of moisture in the indoor air compared to outdoor conditions rather than instantaneous spikes in indoor humidity from short term occupant activities such as cooking or bathing. The vapour pressure difference varies depending on the outdoor temperature to account for seasonal variations, with the greatest vapour pressure difference during cold temperatures below 0oC and reducing with higher temperatures. The vapour pressure difference functions for medium and high humidity loads are presented in Figure 3. This approach is similar to other interior humidity calculations based on vapour pressure difference such as the European Climate Class Model (ISO Standard 13788-01) and British Research Establishment (BRE) model. The vapour pressure differences chosen are representative of design conditions for residential buildings with uncontrolled humidity and adequate ventilation. While these approaches do not account for spikes in interior humidity, the spikes ultimately do not significantly affect moisture accumulation as shown by Roppel et al, 2009.
Figure 3: Variation in vapour pressure difference Figure 4: RH % at the interior surface of exterior based on temperature sheathing of a monitored building for calculated and measured indoor moisture conditions (Roppel et al,2009)
A summary of the indoor conditions with interior humidity and temperature for the example climates is listed in Table 2.
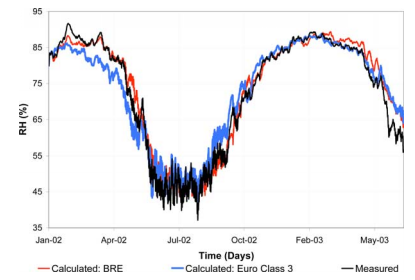

Table 2: Simulated Indoor Conditions during the Heating Season
Climate | Scenario |  Indoor Temperature oC (oF) |  ∆VP | Indoor RH |
Vancouver, BC | Medium Indoor Humidity | 21 (70) | 540 | 35% – 55% |
High Indoor Humidity | 21 (70) | 750 | 40% – 60% | |
Toronto, ON | Medium Indoor Humidity | 21 (70)
| 540
| 25% – 30%
|
High Indoor Humidity | 21 (70)
| 750
| 35% – 50%
| |
Edmonton, AB | Medium Indoor Humidity | 21 (70)
| 540
| 20% – 40%
|
High Indoor Humidity |  21 (70) |   750 |  25% – 45% |
Part of minimizing moisture accumulation in the wall cavity is by placing interior vapour control on the warm side of the insulation as stipulated by building codes in cold climates. However, vapour control layers are not the same as air barriers and even a very small amount of exfiltration can have a bigger impact on moisture accumulation on the exterior sheathing than having no interior vapour control. High indoor humidity and air leakage can lead to problems (Wilson, 1961). Therefore, design limits for indoor moisture levels are dependent on wetting as a result of exfiltration. However, exfiltration can also dry out walls under some conditions. The challenge is that a designer cannot count on uniform exfiltration and the related drying benefits. The following section outlines how to deal with this challenge so that issues related to high indoor humidity and exfiltration can be avoided, but not rely on the benefits of drying as a result of exfiltration.
Defining Exfiltration Loads
Air leakage can have a significant impact on the hygrothermal performance of framed wall assemblies and both the impact of wetting and drying should be evaluated in hygrothermal analysis. For example, exfiltration during the winter can bring warm humid air into the wall cavity resulting in higher moisture levels near the entry point into the wall assembly. Exfiltration during the summer may bring drier air into the wall cavity and remove moisture. In both cases significant amounts of moisture may be added or removed in comparison to vapour diffusion since air is able to carry a significant amount of moisture through the assembly.
Since exfiltration cannot be eliminated, it must be taken into account for the hygrothermal analysis of wall assemblies. The amount of moisture accumulation where the air enters the wall cavity is relatively the same regardless of the path. However, drying by air leakage cannot be counted on and is dependent on the air flow path. Therefore, the wetting aspect of exfiltration needs to be taken into account to establish design limits of some wall assemblies. However, the same scenarios should also be evaluated without air leakage to ensure that the scenarios subject to wetting and drying by exfiltration are more conservative than if there was no air leakage.
The airflow paths for both the 1-D and 2-D models presented in this paper assumed air transfer from the interior to the exterior as exfiltration. The airflow paths were assumed to provide wetting at both the field area and window sill. In the field area the air leakage path was simulated with air entering the assembly near the bottom of the assembly and exiting near the top of the wall similar to the air leakage path from Brown et al. (2007). Detailed 2-D models of this scenario with top and bottom plates were first evaluated to determine representative airflow from air leakage through gaps in the interior drywall. The results showed peak sheathing moisture content typically occurred 1/3 from the bottom of the wall assembly for this scenario as shown in Figure 5. Despite being further away from the entrance of the airflow path where the air has the most moisture, thermal bridging from the framing warms the lower part of the sheathing enough to reduce the amount of moisture accumulation. The resulting sheathing moisture content at the lower 1/3 of the assembly is similar to a simplified 1-D model subjected to the same air leakage rate and path without the top and bottom plates. The simplified 1-D model was subsequently used for this study for the hygrothermal performance in the field area of wall assemblies.
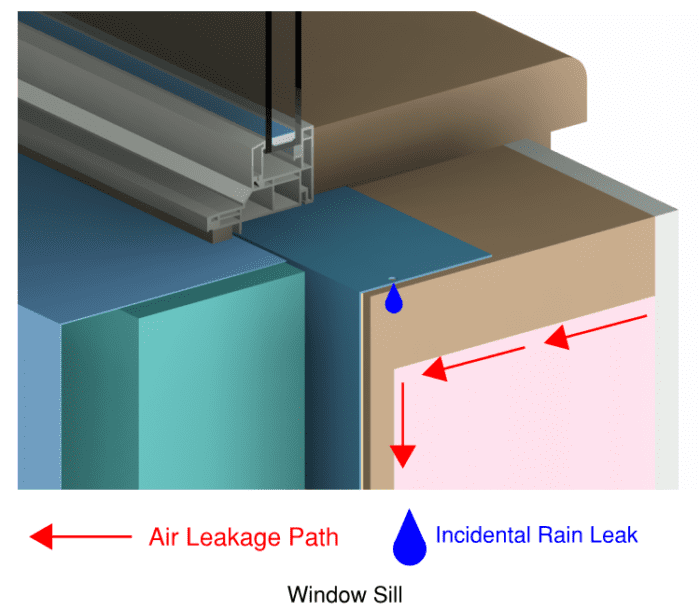
At the window sill the airflow path is simulated with the entrance directly below the sill plate and down in through the wall assembly. This simulates a flow path around the perimeter of the window where moisture accumulates directly on the underside of the sill. The airflow path at the window sill is illustrated in Figure 6.
Figure 5: Simulated air leakage path in field area of Figure 6: Simulated air leakage path and rain leak at wall window sill
The simulated airflow rate presented in this paper is calculated based on a pressure difference across the wall assembly calculated from hourly weather conditions and a characteristic air leakage rate of 0.1 L/s.m2 at 75 Pa. This characteristic air leakage rate is based on the maximum recommended air leakage rate for cold climates with interior RH between 27% and 55% as listed in the NBCC 2015. Hourly airflow rates were calculated based on the characteristic rate and pressure differences from stack pressures from the height of the wall, wind direction, and a constant over pressure of 10 Pa from imposed by mechanical equipment.
While the air leakage rate may be higher or lower at different locations in a building, the objective of this study is to determine how air leakage effects the hygrothermal performance of wall assemblies. Scenarios highlighting how air leakage can result in moisture accumulation in wall assemblies are shown by comparing the same assemblies with and without air leakage.
The impact of exfiltration is dependent on the amount of exterior insulation, the vapour permeance of the

WRBs, air leakage rate, climate, and interior humidity. How the impact of exfiltration is impacted by these factors is discussed later in this paper.
Defining Rain Penetration Loads and Design Limits
Rain penetration is a potential significant source of wetting of framed wall assemblies. Rain leaks into the wall occur at deficiencies in the moisture barrier and are often localized to junctions of components, such as at windows, base of wall, or balconies as seen in Figure 7.
Predictable drying in the building envelope is mostly achieved by vapour diffusion to the outside in heating dominated climates, which is dependent on the material choice of the exterior WRB and insulation. However, drying can also occur via exfiltration, as discussed already, and to the interior space if the indoor air for scenarios where the indoor air is not a potential source of wetting.
Where, how much, and how often are the questions that must be answered when assessing the impact of rain penetration as a wetting mechanism for framed wall assemblies. Rain penetration and the impact ofdrying of wall assemblies has been the focus of numerous field and lab studies. There has been many ways that studies have wetted wall assemblies to
simulate rain penetration and study how walls dry (Ojanen, 1998, Hazleden, 2001, Bomberg, et al, 2002, Straube et al, 2004, St-Hilaire, 2006, Smegal et al,2012, Trainor, 2014). Approaches have varied from trying to add defects and direct water into the assembly, uniform distribution of moisture on the sheathing, immersion of wall panels, and other controlled patterns as seen in:
Figure 8.

These approaches all have approximated the impact of rain penetration by introducing fixed amounts of moisture and introduce the moisture at the start of the study or at regular time intervals as a means to conduct a controlled experiment.
Figure 7: Example of sheathing damage due to rain penetration at window sills

Figure 8: Examples of wetting methodologies in field and lab studies
While these approaches strived to be repeatable and help to study the drying behaviour of framed wall assemblies, they do not completely connect the risk of water penetration to service conditions.
Rain events are variable by nature in duration, frequency, and intensity. As a result, the amount of rain penetration that enters through a deficiency in the moisture barrier is highly
variable and difficult to predict.

An approach to incorporate rain penetration in hygorthermal models to simulate duration, frequency, and intensity is to introduce a percentage of incident rain into the wall assembly as described by ASHRAE Standard 160 (2009).
A complication with evaluating the impact of rain penetration beyond simplified one dimensional analysis and trying to simulate how walls function in service is that the “where” and “how much” questions regarding rain penetration are not well addressed by past studies and current standards. For example, a small defect that resulted in a small area of high moisture levels only when it rained, but otherwise the rest of the component is dry a couple of inches away will not result in a failed wall assembly. In such cases, scenarios with longer periods of high moisture content at the leak location are more likely to have elevated moisture levels adjacent to the leak since there is more time to distribute moisture across the sheathing or framing.
The variation in moisture levels also vary
across the thickness of the materials.
Figure 9 compares the simulated and
measured sheathing moisture content of a
split insulated wood frame wall with OSB
sheathing, XPS insulation and rainscreen
stucco cladding that was monitored as part
of a study conducted by BSC and Gauvin
2000 Construction Limited (Smeagel et al,
2012). The simulated models were
calibrated to the field hut study with the
equivalent of 450 mL (15 oz) of moisture
introduced on to the face of the sheathing per wetting event at similar periods. The first, second, and fourth wetting events introduced moisture on the exterior face of the sheathing while the third wetting event wetted the sheathing on the interior face. From Figure 9, there is some variation between the measured moisture
Figure 9: Comparison of simulated and measured OSB sheathing moisture content at various monitoring locations

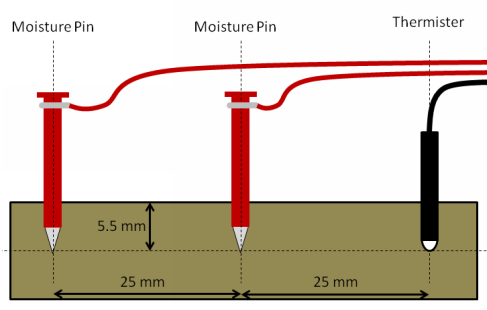
Figure 10: Comparison of simulated and measured OSB sheathing moisture content on the exterior face, midpoint, and interior face, during wetting event on outside of sheathing levels and simulated moisture levels on the exterior face, sheathing midpoint, and interior face. The measured sheathing moisture content were recorded at the midpoint of the sheathing by moisture pins installed through the interior face of the OSB sheathing (Smeagel et al, 2012) as shown in Figure 11. This means that the pins were penetrating the wetted sheet for the interior wetting event. The pins were coated to try and isolate the readings to depth, but higher moisture readings compared to the simulated results is not un-expected given the experimental set-up. The moisture readings for the exterior wetting evens showed good agreement with the exterior and interior monitoring being within similar ranges.
Another consideration when evaluating the impact of rain leaks is that some moisture barriers will allow moisture to distribute more easily behind the moisture barrier from a defect than others. For example, a loose sheet will allow water to run down the sheathing as a result of a defect. This pattern will not happen for a defect in a fully applied liquid or sheet membrane unless the defect is at a joint. As a result, one may consider the “where” and “how much” of the surface is exposed rain penetration differently depending on the type of moisture barrier applied to a wall assembly.
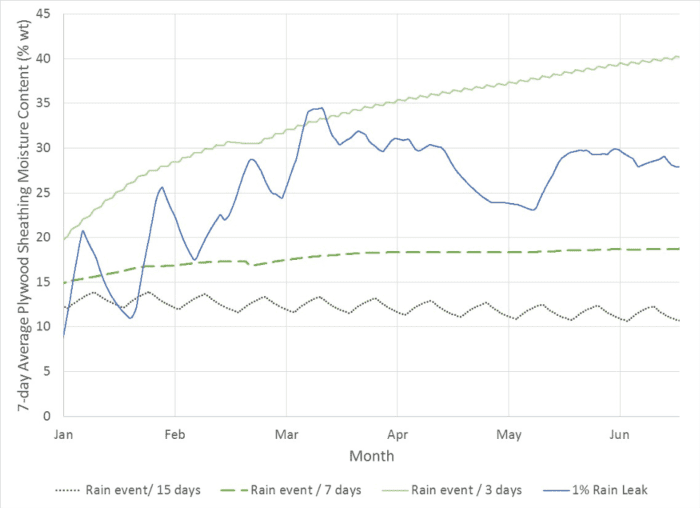
For this paper and related studies, the authors considered simulating the rain leaks as specific quantities at variable intervals to try to establish design limits with regard to rain penetration. However, ultimately this approach was abandoned because it is not consistent with measured rainfall in terms of frequency and intensity. As previously discussed rain events are variable in both duration and intensity and short-intense period of rain may saturate wall assemblies resulting in spikes in moisture content and be followed by dry periods, while extended periods of light rain may not cause spikes in moisture content but may prevent drying resulting in prolonged periods of high moisture levels. An example of wetting following a regular wetting schedule and wetting following measured rainfall is provided in Figure 12.
Figure 11: Location of moisture sensors in Figure 12: Comparison of sheathing moisture content sheathing of field experiment (Trainor,2014) following regular wetting schedule and recorded rainfall
The frequency and intensity of rainfall also varies throughout the year, making it difficult to find an appropriate wetting schedule and quantity that is representative of the simulated climate. Ultimately, rain was simulated as a percentage of the incidental rain, similar to ASHRAE 160, at the exterior face of the
sheathing beneath the WRB in the field area and at the top corner of the window sill beneath the sub-sill membrane. The monitoring locations are located at the leak locations at the sheathing midpoint in the field area and at the top corner of the sill framing at the window sill as shown in Figures 5 and 6.
COMBINING THE LOADS AND ESTABLISHING DESIGN LIMITS
The objective of the paper is to show how the effects of interior humidity, air leakage, and rain penetration can be combined into an approach that enables design limits to be established using hygrothermal analysis of generic wall assemblies. These design limits can help designers make decision on projects without relying or limiting the need for project specific hygrothermal analysis. In this section design limits relating to minimum insulation ratio, maximum allowable interior humidity, and maximum allowable rain penetration are introduced. The design limits are discussed with respect to WRB and exterior insulation vapour permeance for the design of heating dominated climates. Concerns of inward vapour drive for absorptive claddings are also discussed in the context of the design limits.
Minimum Insulation Ratio
The amount and location of insulation in framed wall assemblies can have a significant impact on the hygrothermal performance in the field area of a wall. Insulation can be placed in the stud cavity and/or outboard of the exterior sheathing. In cold climates, moisture accumulation is influenced by the amount of exterior insulation outboard of the sheathing. Exterior insulation reduces the amount of moisture accumulation in the sheathing by raising the temperatures and decreasing the relative humidity at the sheathing. In framed wall assemblies the amount of exterior insulation and stud cavity insulation is expressed as a ratio between the amount of insulation outboard of the sheathing to the amount of insulation inboard the sheathing. This is known as the Insulation Ratio and building codes such as the NBCC have recommended minimums based on heating degree days to avoid moisture accumulation and deterioration. Walls with higher Insulation Ratios are more tolerant of high humidity conditions. The effect of Insulation Ratio on sheathing moisture content of a split insulated wall in Edmonton is shown in Figure 13. Highly vapour permeable insulation and WRB can tolerate lower minimum Insulation Ratios than assemblies with less vapour permeable materials that translate to different design limits. It is worth highlighting that this information can help determine when low permeance materials will work just as well as higher permeance materials or alternatively where there are benefits to higher permeance materials.
Minimum Insulation Ratios are set by evaluating wall assemblies with air leakage at various ratios of exterior to interior insulation to determine ratios that maintains the 7-day average sheathing moisture levels below 28% MC. Examples of minimum Insulation Ratios is summarized in Table 3. The insulation ratios presented
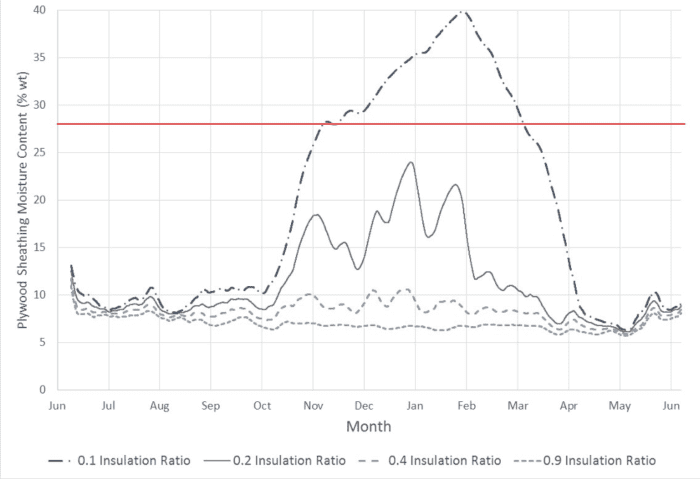
Figure 13: 7-day Average Sheathing Moisture Content of North Facing Wood Frame Wall in Edmonton with Air Leakage in Table 3 do not include the impact of rain penetration.
Table 3: Minimum Insulation Ratio for wood-frame wall assemblies
Location | WRB Vapour Permeance US Perms (ng/s.m2.Pa) | Medium Indoor Humidity Load (540 ∆VP) | High Indoor Humidity Load (750 ∆VP) |
Vancouver | SBS – 0.03 (1.7) | 0.20 | 0.40 |
1 (57.2) | 0.20
| 0.40
| |
10 (572) | 0.15 | 0.40 | |
50 (2860) | 0.15 | 0.30 | |
Toronto | SBS – 0.03 (1.7) | 0.20
| 0.40
|
1 (57.2) | 0.20 | 0.40 | |
10 (572) | 0.20
| 0.40
| |
50 (2860) | 0.15 | 0.30 | |
Edmonton | SBS – 0.03 (1.7) | 0.20
| 0.60
|
1 (57.2) | 0.20 | 0.60 | |
10 (572) | 0.20 | 0.55 | |
50 (2860) |  0.15 |  0.55 |
Maximum Interior Humidity
Interior humidity can have a significant effect on the amount of moisture accumulation within wall cavities if subject to exfiltration and/or there is not interior vapour control for heating dominated climates. Managing the risk of high indoor humidity can be achieved by increasing the Insulation Ratio and/or by vapour permeable materials outboard of the exterior sheathing. An example of the effect of interior humidity on moisture levels at the sill plate for medium and high indoor humidity loads, with vapour permeable and impermeable sub-sill membrane, is shown in Figure 14.
Maximum interior humidity levels for steel-framed walls following prescriptive insulation requirements for ASHRAE 90.1 is summarized in Table 4.
Figure 14: 7-day average sill plate moisture content of north facing wood frame wall in Vancouver with high indoor humidity and low and high vapour permeable sub sill membranes subject to air leakage
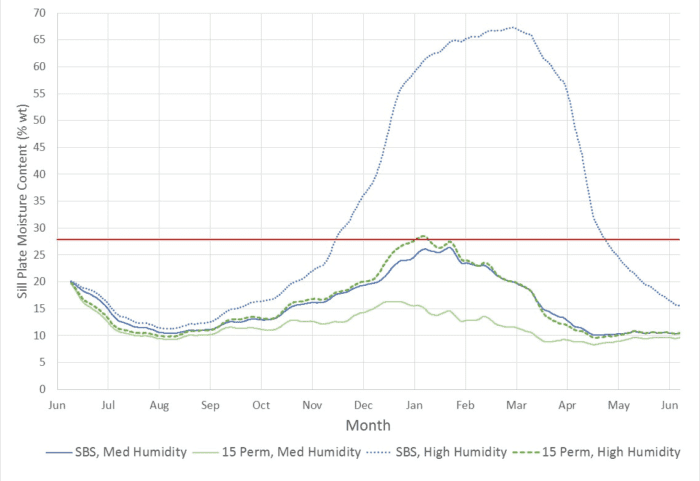
Table 4: Maximum interior humidity for steel-framed wall assemblies following ASHRAE 90.1 prescriptive path requirements subject to air leakage without rain penetration
Location | WRB Vapour Permeance US Perms (ng/s.m2.Pa) | Maximum Interior Humidity Load
|
Vancouver | SBS – 0.03 (1.7)
| Medium (540 ∆VP)
|
1 (57.2) | ||
10 (572)
| ||
50 (2860) | ||
Toronto | SBS – 0.03 (1.7) | High (750 ∆VP)
|
1 (57.2)
| ||
10 (572) | ||
50 (2860)
| ||
Edmonton | SBS – 0.03 (1.7) | High (750 ∆VP)
|
1 (57.2)
| ||
10 (572) | ||
50 (2860)
|
Maximum Allowable Rain Penetration
Vapour impermeable membranes, such as SBS rubberized asphalt with polyethylene film, provides no opportunity for drying to the exterior and is less tolerable to rain penetration. This is also true at window sills where rain leaks can occur due to defects. As a result, assessing the tolerance of wall assemblies to bulk moisture from rain penetration is important when selecting materials outboard of the wall structure.
The maximum allowable rain penetration is determined by varying the percentage of incidental rain introduced at the leak location until the acceptance criteria is no longer satisfied. An example of the maximum allowable rain penetration for east-facing wood-frame assembly at the window sill in Toronto is provided in Table 5.
Table 5: Maximum allowable rain penetration for wood-framed wall assemblies not subject to air leakage at a window sill in Toronto
Minimum Insulation and Membrane Vapour Permeance
Low vapour permeance insulation such as Extruded Polystyrene (XPS) and polyisocyanuarate (polyiso) allow little drying to the exterior via vapour diffusion when the insulation is installed tight against the sheathing.
Sub Sill Vapour Permeance US Perms (ng/s.m2.Pa) | Maximum Allowable Rain Penetration Percentage of Incident Rain |
SBS – 0.03 (1.7)
| 0.5%
|
1 (57.2) | 0.5% |
10 (572) | 1% |
15 (8923)
| 1% |
However, an interesting finding surfaced as part of this analysis when the impact of a small drainage gap is
introduced between the low permeance insulation and high permeance sheathing membrane. A small gap (1/4 inch or 6mm) with a vapour diffusion path to the bottom of a 10 foot wall allows enough moisture to diffuse to the exterior, so that a wall with polyiso behaves the same as a wall with mineral wool. Figure 15 shows the relative humidity levels at the interior face of the gypsum sheathing for a split insulated assembly with mineral wool and polyiso insulation with and without a drainage gap. This example illustrates that sufficient drying capacity maybe provided with low vapour permeable insulations
and vapour permeable WRBs, but this possibility would likely require more validation before widely adopted by practitioners. The examples shown in Figure 15 are not subjected to air leakage, since air leakage reduces the amount of variance between the wall assemblies because air flow through the stud cavity dominates both wetting and drying.
Inward Vapour Drive
High vapour permeable membranes with absorptive cladding and inward vapour drive is sometimes a concern for some scenarios. One of the most commonly cited examples is a wall with brick veneer cladding, where the bricks can be saturated from the rain and then is heated by the sun. Although the exterior vapour pressure was increased due to solar heating the saturated bricks, there is very little increase in the wall cavity moisture levels even with a highly vapour permeable WRB when used with a vented rain-screen. The brick cavity will remove most of the vapour held within the brick. The analysis revealed that the sheathing wall cavity moisture levels were sensitive to ventilation, but not sensitive to the assumed ventilation rate in the order of magnitude of 1 to 10 ACH. Various ventilation rates were tested including ventilation rates based on stack pressures from temperature difference between the rainscreen cavity and the exterior as well as ventilation rates between 1 to 10 ACH (Straube et al, 2009). All three ventilation rates modeled resulted in similar sheathing moisture levels. Differences in moisture levels were only noted for cases without vented rain- screens as shown in Figure 16, however, the differences were minor and did not significantly affect the design limits determined in this study.
Another concern with vapour permeable WRBs and inward vapour drive is at window sills due to standing water at the sill. This scenario was also evaluated for a window sill in Vancouver with 100% RH on the outside to simulate the vapour drive associated with standing water. The simulation was carried over the course of the year and showed very little difference in moisture levels of a similar sill without standing water.
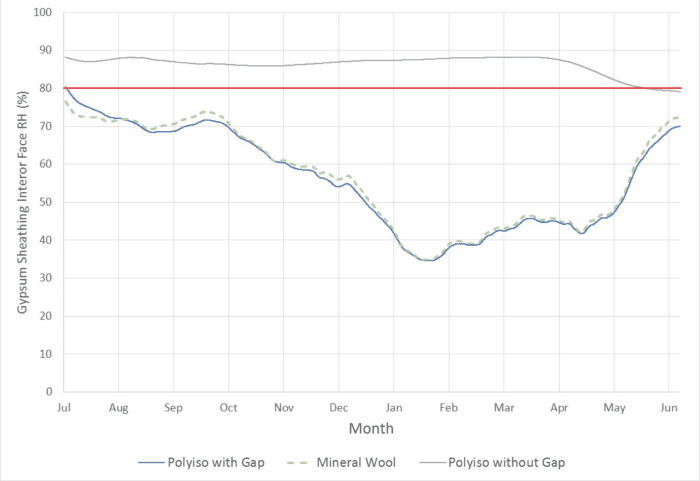
Figure 15: 30-day average relative humidity of gypsum exterior sheathing at the interior face of north facing split insulated steel- frame assemblies in Toronto, not subjected to air leakage with 50 Perm WRBs without rain penetration.
Provided that the sub sill membrane remains water-tight when subject to standing water, high vapour permeable membranes will not result in higher moisture content at the sill when subjected to standing water and provides greater drying capacity making it more tolerant of moisture from exfiltration, rain leaks, and construction moisture.

Figure 16: 30-day Average Interior Drywall Relative Humidity on Exterior Face of East Facing Interior Insulated Wood Frame Walls in Toronto, without Air Leakage, with Vented and Unvented Rainscreen Cavity and Brick Cladding
CONCLUSIONS

Figure 17: 7-day average sill plate moisture content of east facing wood frame wall in Vancouver with medium indoor humidity and low and high vapour permeable sub sill membranes not subjected to air leakage with and without standing water on sill
A primary objective of this paper was to outline how to establish design limits for the design and selection of insulation and membrane materials for framed wall assemblies using hygrothermal analysis from a holistic standpoint of establishing loads and performance criteria. Examples were provided to show how environmental loads, such as rain penetration and air exfiltration, can be related to design limits such as indoor humidity, Insulation Ratio, and maximum allowable rain penetration. This work expands upon normal practice for hygrothermal analysis by introducing concepts that are not widely utilized in practice and explores the impact not only to the clear field assembly, but also to critical junctions, such as window sills. Critical junctions such as window sills are often overlooked at practice and warrants more attention when striving to closer align hygrothermal analysis with reality. A fresh viewpoint to how walls assemblies are assessed has yielded interesting findings that do not completely align with some conventional wisdom and have reinforced other long standing beliefs for the selection of insulation and membranes of framed wall assemblies. High level findings include:
- High vapour permeable membranes and insulation provide more capacity for drying of moisture in the field area than with lower permeable membranes, but the difference can be minimized with higher insulation ratios for the walls with lower materials.
- High vapour permeable sub-sill membranes at window sills are more tolerant of rain penetration and the benefit outweighs the concern of standing water on top of sub-sill resulting in inward vapour drive and moisture accumulation of a wood sill.
• Assemblies with low vapour permeable insulation, such as polyiso, can benefit from a high vapour permeable membrane if a small drainage gap is provided between the insulation and sheathing. Such assemblies with vapour permeable WRB have the potential to have similar performance to the same scenario with a high perm insulation such as mineral wool, in a cold climate.
The design limits presented in this study provides guidance for designers to assess the hygrothermal performance of framed wall assemblies not only in the field area of the wall but also at junctions, such as window sills. Applying this methodology to more climates and scenarios to develop a design tool can aid in making decisions about material selection and wall configurations for project specific designs. Findings from this work highlights that there is no “goldilocks” permeance and industry does not need to ban the use of low vapour permeance materials outboard of the structure nor be afraid of highly permeable membranes. There are only design limits and benefits that can be quantified to determine what makes sense on a project to balance all design constraints and considerations such as costs, wall thickness, and energy efficiency targets.
In conclusion, we can serve you with the products you need, starting with the wood fiber insulation boards to the tapes and accessories needed.
Just click the link below and start shopping. Insulate your home, it is important.
https://gswrap.com/product-category/wood-fiber-board/